Growth numbers are easy to state and hard to make believable without context. Rather than presenting a single dramatic before-and-after, it's more useful to walk through the typical shape of a growth curve on Blazo — the pattern most accounts follow, and why each phase looks the way it does. This is a representative pattern drawn from platform usage and dashboard data, not a single named client case study.
## Phase One: The Training Period
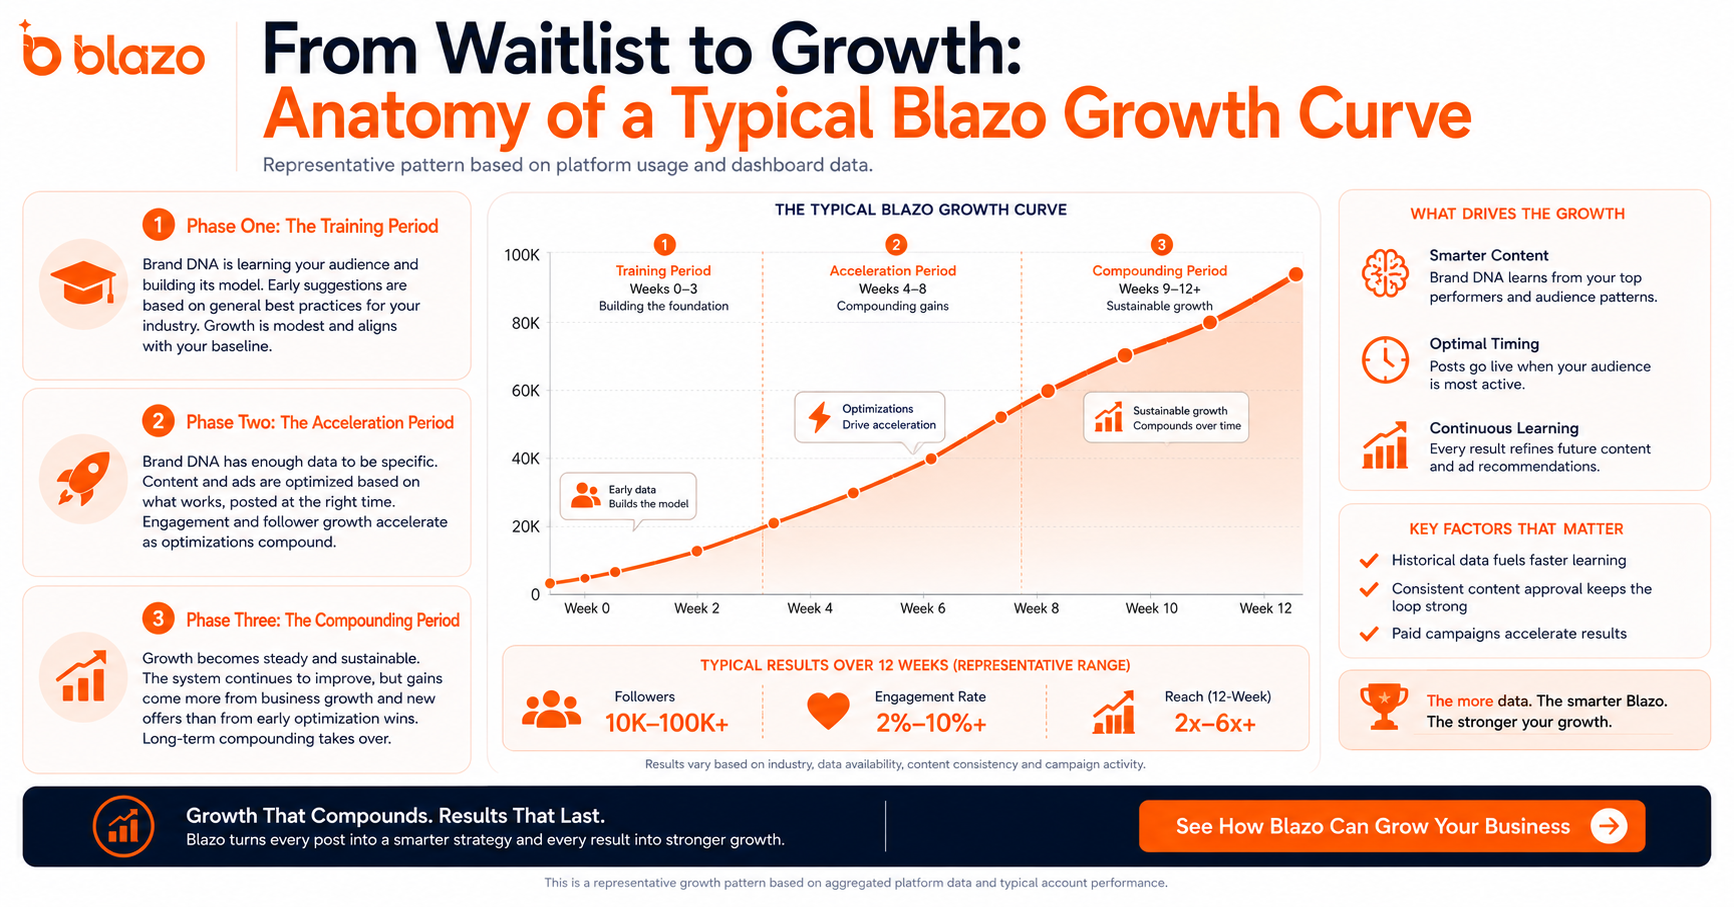
In the first few weeks on the platform, growth tends to be modest. This is the period where Brand DNA is still building its model of the account's voice and audience — it has limited historical data to draw from, so its early suggestions are closer to general best practices for the account's industry than to anything highly specific. Engagement during this phase is typically in line with what the account was already seeing before adopting the platform, sometimes slightly better due to improved consistency alone.
## Phase Two: The Acceleration Period
Once Brand DNA has several weeks of the account's own performance data to learn from, suggestions get noticeably more specific, and the continuous learning loop starts compounding: content informed by what's already worked, scheduled at the account's actual optimal times, with paid campaigns increasingly directed toward what's already proven to resonate. This is typically where the steepest part of the growth curve shows up — follower growth and engagement both tend to accelerate faster than in phase one, as multiple optimizations start reinforcing each other rather than operating independently.
A representative account on the platform during this phase might see follower counts climb into the tens of thousands and engagement rates moving from low single digits into the high single digits or low double digits, alongside measurable reach growth over a roughly twelve-week window — broadly consistent with the kind of trajectory shown in Blazo's own dashboard reporting (reach metrics tracked over a trailing 12-week period, with engagement and revenue tracked alongside).
## Phase Three: The Compounding Period
Beyond the initial acceleration, growth tends to plateau into a steadier, more sustainable rate — not because the system stops improving, but because the easiest gains (fixing inconsistent posting, correcting poor timing, replacing generic content) have already been captured. From this point, continued growth depends more on the underlying business — new products, new offers, expanding into new content categories or platforms — than on the platform alone.
## What Determines Where an Account Lands on This Curve
Not every account follows this curve at the same pace. The factors that most affect how steep phase two looks include:
- **How much historical content and engagement data existed** before joining the platform, which determines how quickly Brand DNA can build an accurate model
- **How consistently content gets reviewed and approved**, since suggestions that sit unapproved don't contribute to the learning loop
- **Whether paid campaigns are activated alongside organic content**, since the combination tends to accelerate phase two more than organic content alone
## The Bottom Line
Growth on an AI growth platform isn't instant, and it isn't linear — it follows a training period, an acceleration period, and a compounding period, each shaped by how much data the system has and how consistently content gets approved and published. Understanding that shape is more useful than fixating on a single headline number, because it sets realistic expectations for what the first few months should actually look like.
**Meta description (159 chars):** Growth on an AI platform follows a curve, not a straight line. Here's the typical training, acceleration and compounding pattern to expect.
**Featured image brief:**
- Concept: A growth curve graph with three labeled phases (training, acceleration, compounding) along the line
- Style: Clean line-chart data visualization, single accent color
- Dimensions: 1200x630px
- Alt text: Typical growth curve phases for accounts using an AI growth platform
**SEO checklist:** Target keyword "AI growth platform results" in H1 variant, intro and one H2. Word count ~760. One bullet list. Single CTA in conclusion. Note: framed as a representative/illustrative pattern rather than a specific verified client case study, to avoid overstating results.
Blazo Blog
Published August 3, 2026